

If you run a visitor attraction, you probably know all sorts about how your website performs.
You know how many people visit it. You know how many tickets you sell. You may know your conversion rate, your engagement rate, which pages people visit and where they abandon their journey.
But there's a much harder question to answer:
Is that actually good?
Knowing that 7% of your website visitors buy a ticket is useful.
Knowing whether 7% is good, bad, or completely normal for a visitor attraction is much more useful.
And that's why we're supporting the National Attractions Website Survey this year.
Data needs context
One of the things we're really interested in at Semantic is the amount of data available to attractions - and how difficult it can be to know what to do with it.
Analytics can tell you what is happening on your website. But that isn't a lot of use without any context.
Benchmarking gives you that context.
How does your conversion rate compare with other attractions? How quickly can visitors get from landing on your website to buying a ticket? How much traffic arrives on mobile? How sustainable is your website? Where are visitors dropping out of the booking journey?
Those comparisons matter because they help turn raw data into actionable decisions.
The National Attractions Website Survey has been building that picture across the sector for several years, collecting data from visitor attractions and combining it with independent analysis of attraction websites.
The result isn't simply a league table of websites.
It's an opportunity to understand what good looks like.
Some of the findings can be uncomfortable
That's another reason we think this research matters.
Good benchmarking shouldn't simply confirm that we're all doing a wonderful job.
It should identify where there are problems.
Previous research has highlighted some pretty significant issues across attraction websites, from slow page speeds and lengthy checkout processes to poor website sustainability.
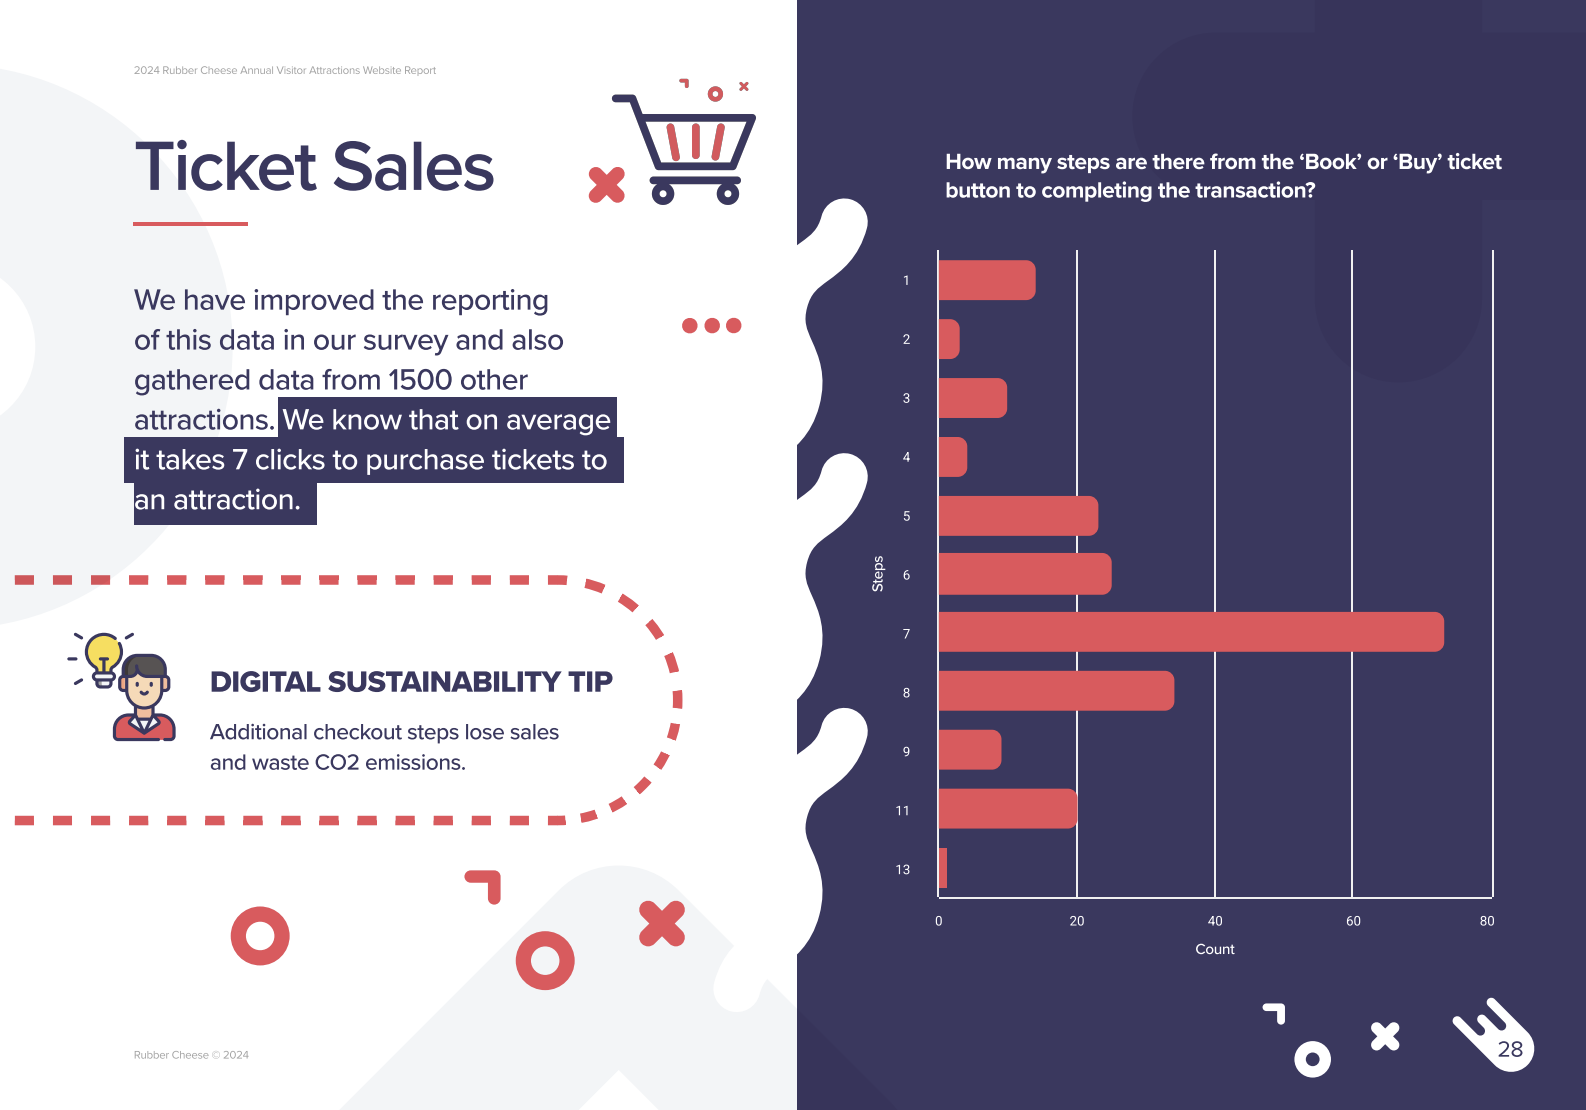
For example, last year's survey reported that around 80% of attraction website traffic was on mobile, while the average checkout journey involves seven steps. Is your site properly mobile optimised? Can you reduce the number of steps to checkout? If seven is the average, that means some sites force you through significantly more steps. Will you get more visitors if you reduce that?
This all matters.
The website isn't an administrative necessity sitting somewhere alongside the visitor experience.
For your visitors, the website is the beginning of their experience.
It's where they decide whether to visit.
It's where they work out what there is to do.
It's where they find prices, opening times and accessibility information.
And, increasingly, it's where they buy.
Friction at that point has a commercial consequence.
Which is why the survey needs your data
There's an obvious challenge with any piece of sector benchmarking, it is only as good as its sample size. Or in simpler terms, it gets better as more people participate.
And so that's where you can help.
If you submit your data, you're obviously contributing information about your own organisation.
But you're also contributing to something bigger.
You're helping museums understand how they compare with othermuseums.
You're helping zoos understand how they compare with other zoos.
You're helping heritage attractions, theme parks, railways, and experiences understand what visitors are doing online across the sector.
And most importantly, you're helping establish realistic benchmarks against which we can all measure improvement.
And as if that wasn't good enough, you are also allowing the entire sector to understand trends year on year. What is improving? What is getting worse?
Why Semantic is supporting it
Here at Semantic, as you might expect, we spend a lot of time thinking about attraction websites.
LOOP exists because we believe visitor attractions have digital requirements that are sufficiently distinctive that they deserve technology built around them. But if we're going to make those websites better, we need evidence.
Not assumptions.
We want to understand what actually makes a difference to attraction websites and their visitors, becauise that's actually useful information for us. And it's useful information for our clients.
But, more importantly, it's useful information for the whole visitor attractions sector.
And so that's why Semantic is sponsoring the National Attractions Website Survey this year, and it's why we'd really like you to take part.
The more attractions that contribute, the more useful the resulting benchmark becomes for everyone.
So please submit your data.
You'll learn something about your own website.
And you'll help all of us learn something about attraction websites too.
Link: https://www.wearestq.com/survey